Market Making on Polymarket with an Options Pricing Anchor
Building an options-anchored ETH paper market maker and evaluating its fills against subsequent market prices, with lessons in execution, inventory, and risk.
A Polymarket contract asking whether ETH will finish above a particular price looks a lot like an options problem. It pays a fixed amount if ETH clears the strike at expiry and nothing otherwise. Meanwhile, an entire options market is continuously pricing exposure to the same underlying asset. That made me curious: could I use those prices to make a useful two-sided market in ETH prediction contracts?
I built a Python market-making research system that connects options-derived valuations, Polymarket liquidity, and cross-venue inventory management. The hypothesis is that an external options reference can improve quote selection and inventory decisions enough to cover adverse selection and hedging costs.
The pilot consumes live market data; its orders, fills, and balances are simulated. Over a 34-day session, it recorded 331 simulated fills. This case study follows the work from contract matching and valuation through to a focused review of what happened to market prices after those paper fills. Detailed market-selection, quoting, and calibration rules are omitted.
At a Glance
| Layer | What I built |
|---|---|
| Contract mapping | Normalization of terminal ETH binaries, including payoff, resolution conventions, and trading constraints |
| Pricing | An options-derived reference value with explicit model uncertainty |
| Market making | Quotes informed by valuation, outcome-book liquidity, inventory, and available collateral |
| Hedging | A simulated ETH perpetual hedge with separate venue capital, spread costs, fees, and funding |
| Evaluation | Trade-driven paper fills, market-price markouts, portfolio valuations, and a durable record of execution and risk decisions |
A 34-Day Paper Pilot
The August 3–September 6 session provided a sustained record of quote decisions, simulated fills, and inventory changes. I selected one complete week within it for a focused execution study, fixing the window before examining its results.
| Measure | Scope | Result |
|---|---|---|
| Elapsed session time | August 3–September 6, 2026 | 34 days |
| Simulated Polymarket fills | Full session | 331 |
| Fills in the markout study | August 24–30, 2026 UTC | 48 |
| Contracts in the markout study | Same selected week | 25 |
| Fills with valid market references | All five measured horizons | 48 / 48 |
For each selected fill, I reconstructed the prevailing market midpoint and its subsequent movement from the archived feed. That gives the execution study a reference independent of the strategy’s own valuation. The results below concern those 48 paper fills; they do not measure full-session portfolio returns.
How the Paper Loop Fits Together
The system connects contract discovery, pricing, quoting, simulated execution, inventory, hedging, settlement, and reporting. Deribit supplies the options inputs; the hedge model uses Hyperliquid market data. The pilot does not execute options trades.
Each stage leaves an observable record. That makes it possible to trace a simulated fill back to its valuation and risk context, then follow its effect on inventory, hedge activity, and portfolio value.
Start with the Contract, Then Price It
“ETH above $2,000” is not a complete instrument definition. The resolution source, observation time, comparison rule, and payoff style all matter. A contract that pays if ETH touches a level during the week is fundamentally different from one that pays if ETH closes above it at a specified time.
The initial model covers terminal payoffs. Mapping those contracts to options requires accounting for differences in expiry and settlement conventions; even exposure to the same underlying asset can retain meaningful basis risk. Deribit’s contract specifications illustrate why those conventions belong in the instrument definition.
I made contract normalization a prerequisite for pricing. A superficially similar options contract is only useful if the relationship between its payoff and the prediction contract can be explained.
The pricing engine uses option-implied information to estimate a reference value and its sensitivity to uncertain inputs. This is a risk-neutral pricing reference: options prices also reflect risk premia, positioning, and liquidity. It should not be read as a forecast of the outcome’s true probability.
The current model is a digital approximation, with limitations around the volatility smile, discrete strikes, and settlement basis. It does not fit a full arbitrage-free surface or establish an executable options replication. Making those limits explicit is part of deciding when a valuation is useful.
A Valuation Has to Survive Execution
An attractive reference price is the beginning of the trading decision. Available liquidity, queue position, inventory, and funding determine whether a quote is useful and whether its apparent margin can survive execution.
I built the quoting layer to account for both outcome books and the portfolio’s ability to carry additional exposure. Polymarket’s outcome-token structure also affects the inventory needed to support bids and asks. Its market-making documentation provides the underlying mechanics.
The research system records the valuation and risk context behind its quotes alongside subsequent fills and marks. This lets me examine execution quality separately from whether the model liked the original price.
One recurring lesson was the cost of queue churn. Frequently updating a quote can consume useful queue position without improving the eventual trade. Another was hedge turnover: changes in price and time can require rebalancing between binary fills. Competitive quoting is only useful if the portfolio can retain enough value after those costs.
Inventory Is Also a Funding Problem
The paper account models collateral-backed outcome inventory, reserves cash for bids, and limits asks to tokens available for sale. It also maintains separate budgets for prediction-market inventory, hedge margin, and reserve capital.
Those distinctions matter because cash held on one venue cannot immediately support a position on another. A small binary premium can also carry substantial delta near the strike and expiry. A portfolio that looks modest in premium terms can demand much more hedging capacity than expected.
The simulated perpetual hedge uses live bid/ask data, configured fees, and observed funding rates. Its capacity is constrained by the hedge account’s capital and risk limits. Risk controls distinguish increasing exposure from reducing it, alongside checks on data quality and portfolio loss.
Position lifecycle is equally important. Held inventory remains part of the risk book after it becomes unsuitable for new quotes or loses its original market-data mapping. The system explicitly tracks missing valuation coverage so an unpriced position cannot silently disappear from measured risk.
Delta hedging still leaves jump risk, volatility changes, settlement basis, and discrete rebalancing costs. Building the funding and risk constraints into the paper loop makes those limitations visible before live capital is involved.
Make the Paper Fills Earn Their Place
For a passive strategy, the fill model can determine the apparent result before the pricing model gets a fair test. I therefore evaluate quotes against observed trades and queue assumptions, rather than assuming a fill whenever the book reaches a quoted price.
An early pilot exposed a concrete error: an eight-share trade printed through a ten-share paper ask, and the original simulator filled all ten. I corrected the rule to cap fills at the observed trade volume and separated the affected development cohorts from later results.
That correction became a useful research habit: inspect individual executions before trusting the aggregate curve. The ledger retains entry valuations and subsequent marks, allowing me to examine adverse selection alongside inventory and hedge consequences.
Paper execution and measurement methodology
Window and provenance. The reported session began at 09:43:40 UTC on August 3, 2026; the snapshot was taken at 16:30:12 UTC on September 6. The session dates and fill count come from deployed paper-pilot telemetry, cross-checked with contemporaneous worker logs and reporting code. The selected week’s fills were read from the ledger and matched to archived source trades for the markout study. July development cohorts are excluded.
Fill assumptions. The simulator records displayed quantity ahead when a quote is placed. Reported trades at the order price consume that queue first. A trade through the price clears the queue assumption, with simulated fills still capped by reported trade size. Book cancellations and midpoint changes do not create fills.
A quote must be at least 250ms old before a trade can fill it. This is a simulation assumption, not a measured live submission guarantee. Queue cancellation, hidden liquidity, and the market impact of inserting the simulated order remain limitations.
Quote activity. In the full session, 50.7% of recorded quote observations had at least one active side. This observation-based measure does not establish wall-clock uptime or continuous two-sided liquidity. The 34 days describe elapsed session time, not uninterrupted quoting.
What Happened After the Fills?
I selected August 24 at 00:00 through August 31 at 00:00 UTC for a focused execution review, before examining the window’s results. The ledger contained 48 simulated fills across 25 contracts. Replaying the archived market feed matched every fill to a unique source trade and provided valid midpoint references at every measured horizon.
The chart separates the initial price advantage against the market midpoint from the market’s subsequent movement. Both lines use the same 48 fills and are weighted by filled shares; positive values favor the maker.
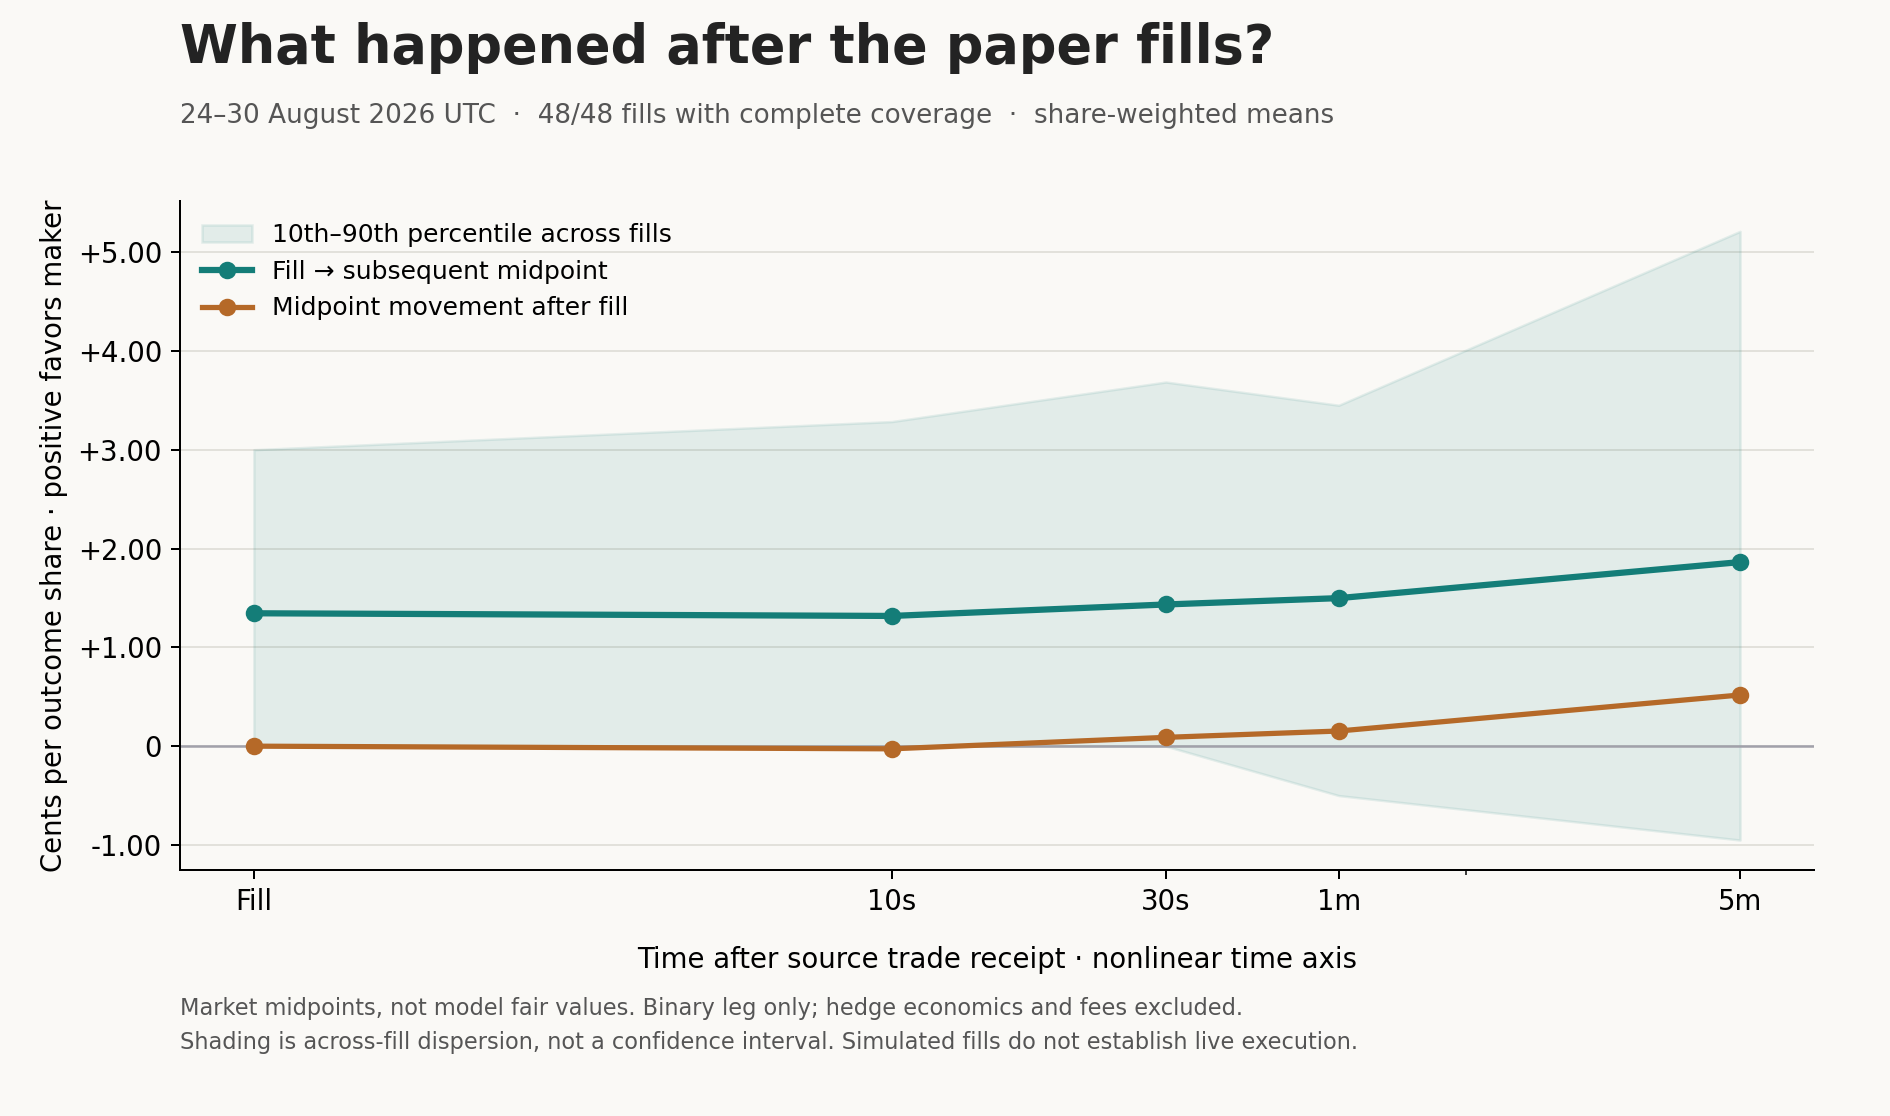
At the fill, the average advantage against the prevailing midpoint was +1.34¢ per share. There was a small adverse midpoint move at ten seconds; by five minutes, the fill-to-midpoint markout was +1.86¢, comprising that initial advantage and +0.52¢ of favorable subsequent market movement. The median five-minute markout was +1.50¢: 39 fills were positive, seven negative, and two flat.
The five-minute mean remained positive with stricter quote-age limits and when each contract was excluded in turn. That is encouraging for the selected paper executions, but the sample is small and the contracts share ETH exposure. A common market move can affect several fills together.
These binary-leg markouts exclude hedge economics and fees, and midpoints are reference prices rather than executable exits. The study does not isolate the options anchor’s contribution against a simpler quoting baseline, or establish the hedged strategy’s profitability. It provides a record of how those paper execution prices compare with the subsequent market.
Market-price markout methodology and sensitivity checks
The reference is the midpoint of the directly traded token’s bid and ask. Horizon timing starts when the source trade reached the pilot’s feed. The baseline uses the book immediately before that event; later references use the last book update received before each target time, without interpolation from future data. Measurements are taken at entry, 10 seconds, 30 seconds, one minute, and five minutes.
Buy fills receive a positive sign and sell fills a negative sign. The fill-to-midpoint markout is the signed difference between the subsequent midpoint and fill price. Subtracting the initial midpoint advantage isolates the signed market move after the fill. Values are expressed in cents per outcome share.
The primary analysis rejects references older than 60 seconds, invalid or crossed books, ambiguous source matches, and horizons at or beyond expiry. Feed health events clear cached books. All 48 fills passed at every horizon; the largest reference age was 47.1 seconds. These checks establish coverage for the recorded feed, not live order placement or executable exit depth.
As a secondary sensitivity check, a ten-second quote-age limit retained 40 fills and produced a +1.54¢ five-minute mean. Leaving out each contract in turn gave five-minute means between +1.42¢ and +2.04¢. The primary cohort and curve remain unchanged. These are robustness checks within one week, not independent market-regime tests.
The vector chart is available. Individual trades and market identifiers remain private.
Evaluate the Portfolio, Not Just the Entry
I keep three valuation questions separate:
| View | Question it answers |
|---|---|
| Model mark | What is the inventory worth under the pricing model? |
| Liquidation estimate | What would the portfolio be worth using closing-side prices and modeled costs? |
| Realized accounting | What remains after reconciling cost basis, closed positions, settlements, and costs? |
The distinction prevents a return of complete-set collateral from being counted as trading profit, or a favorable model mark from standing in for an available exit. Unreconciled rebates remain excluded from performance calculations.
The pilot tracks model and closing-side portfolio marks, including modeled hedge spread, fees, and funding. Those marks remain preliminary telemetry estimates. Full-session ledger reconciliation and drawdown analysis are outstanding, so I am not reporting a portfolio return here.
The distinction matters even when the fill prices look encouraging: spread capture has to survive hedge costs, funding, and changes in inventory value. The market-price study supplies evidence about the execution component of that question; a portfolio result requires the complete accounting.
Where the Project Stands
The paper pilot has turned a pricing idea into a running system whose decisions I can inspect and test. The favorable markouts in the selected week give me a reason to keep building, alongside a clearer understanding of what the experiment has established so far.
What excites me most is the meeting point between options research, market structure, and systems engineering. This project has been a chance to follow an idea from a model through to a running paper market maker, and learn from what happens along the way. I’m now working to bring the strategy into production.
Written by
Kai Aldag
I research on-chain markets and build the systems to trade them. I write about protocol mechanics, execution infrastructure, and what I learn along the way.